Show menu
imuno® compared to GcMAF
Based on data published in peer reviewed journals.
Download Full Report
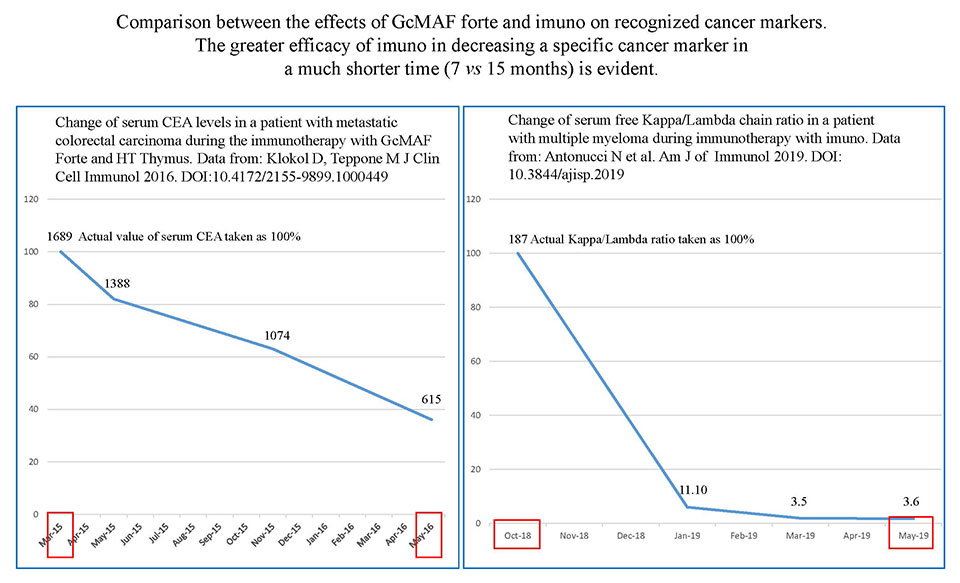
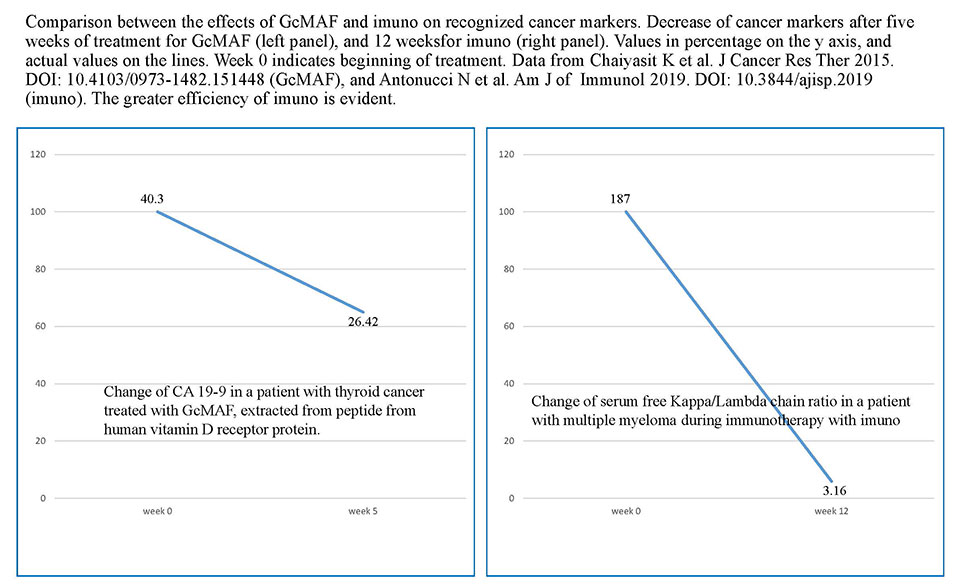
- The figure above compares the descending trend of two cancer markers following immunotherapy with GcMAF Forte or imuno.
- GcMAF Forte was used together with thymus peptide extracts for about 15 months (March 2015 – May 2016) in a patient with metastatic colorectal carcinoma.
- The examined cancer marker was CEA (serum carcinoembryonic antigen) a recognized cancer marker that, however, is not specific for colorectal carcinoma.
- The final value for CEA was about 36% of the initial value with a decrease of about 65%.
- imuno was used for about 7 months (October 2018-May 2019) in a patient with multiple myeloma.
- The examined cancer marker was the ratio of serum free Kappa and Lambda light chains, a marker highly specific for the disease.
- The final value was about 1.68% of the initial value with a decrease of about 98%.
- In short, GcMAF Forte decreased a cancer marker by 65% in 15 months; imuno by 98% in 7 months.
- The original values for each cancer marker are reported in the figure; the graphs are drawn considering the initial value for each cancer marker, i.e. the value before treatment, as 100%.
- All the data used to draw this figure are in the open access public domain.
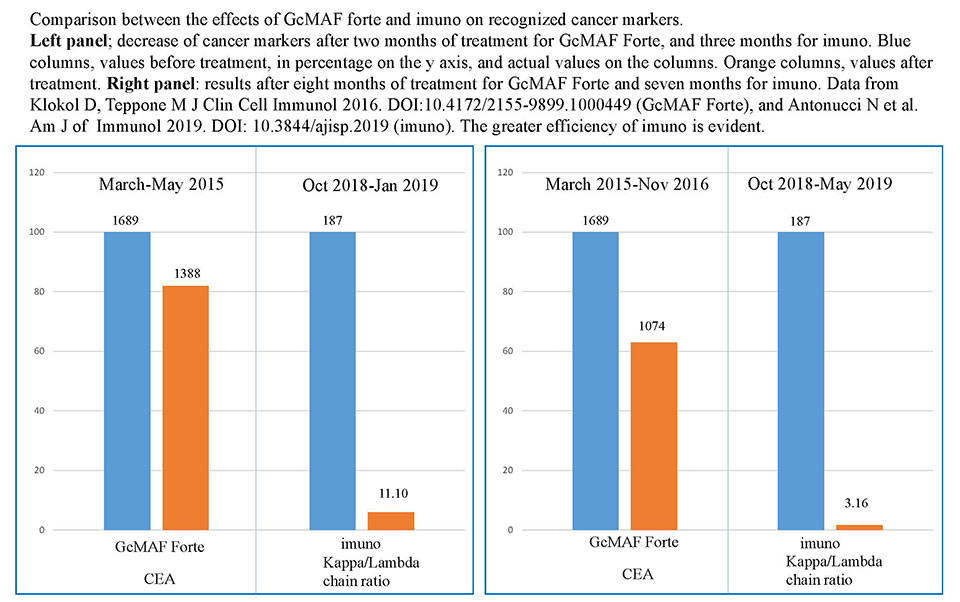
- The figure above compares the descending trend of two cancer markers following immunotherapy with GcMAF Forte or imuno.
- This figure refers to the same patients described in the previous figure.
- In this figure, the comparison between two month treatment with GcMAF Forte and three month treatment with imuno is drawn in the left panel.
- The comparison between eight month treatment with GcMAF Forte and seven month treatment with imuno is drawn in the right panel.
- In both cases, the greater efficiency of imuno in lowering a specific cancer marker is evident.
- The original values for each cancer marker are reported in the figure; the histograms are drawn considering the initial value for each cancer marker, i.e. the value before treatment, as 100%.
- All the data used to draw this figure are in the open access public domain.
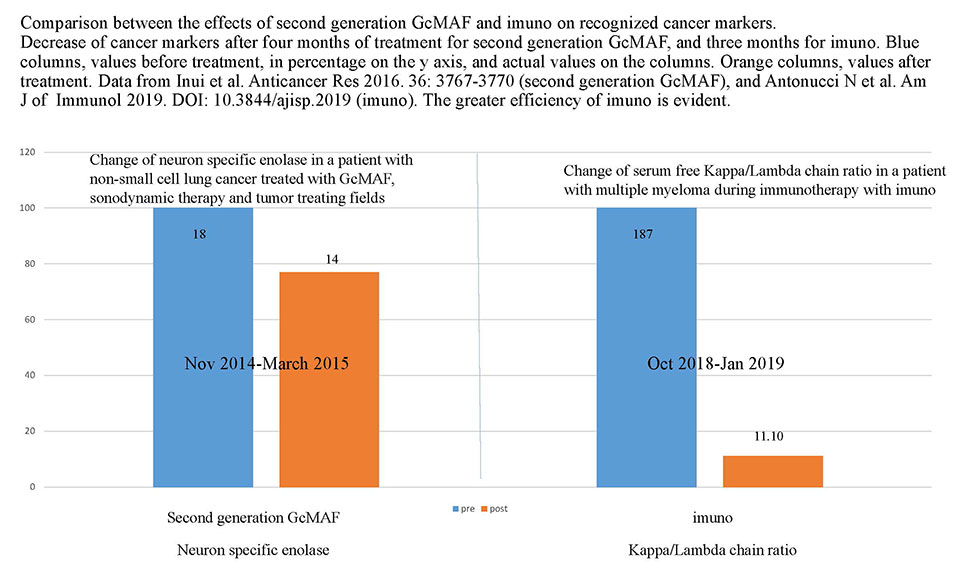
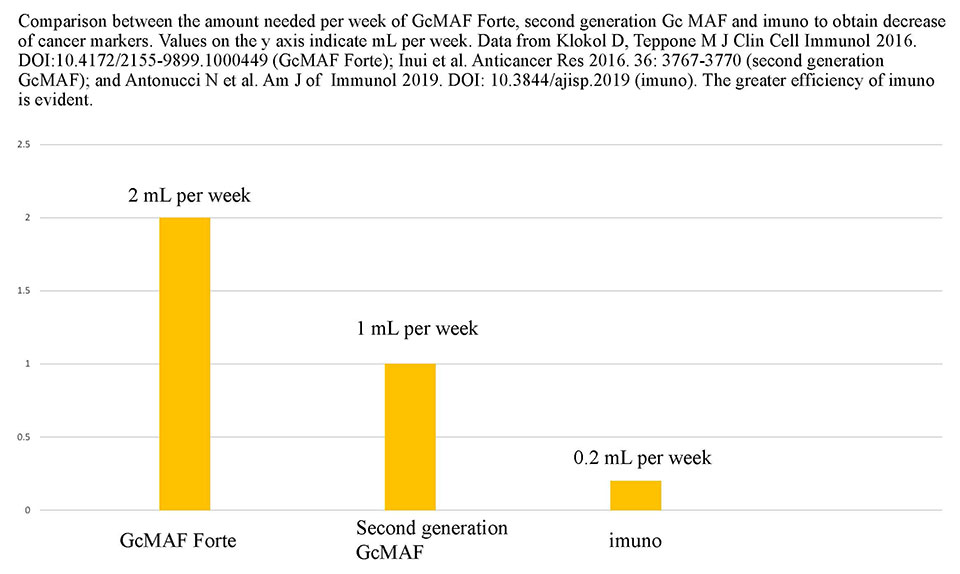
- The figure above compares the descending trend of two cancer markers following immunotherapy with second generation GcMAF or imuno.
- Second generation GcMAF was used together with sonodynamic therapy and tumor treating fields patient for about 4 months (November 2014 – March 2016) in a patient with non-small cell lung cancer.
- The examined cancer marker was neuron specific enolase (NSE), a recognized cancer marker that, however, is considered to show low sensitivity in non-small cell lung cancer (Lung Cancer. Vol 31, Issues 2–3, March 2001, pp 221-231).
- The final value for NSEwas about 77% of the initial value with a decrease of about 23%.
- imuno was used for about 3 months (October 2018-January 2019) in a patient with multiple myeloma.
- The examined cancer marker was the ratio of serum free Kappa and Lambda light chains, a marker highly specific for the disease.
- The final value was about 5.93% of the initial value with a decrease of about 94%.
- The original values for each cancer marker are reported in the figure; the histograms are drawn considering the initial value for each cancer marker, i.e. the value before treatment, as 100%.
- All the data used to draw this figure are in the open access public domain.